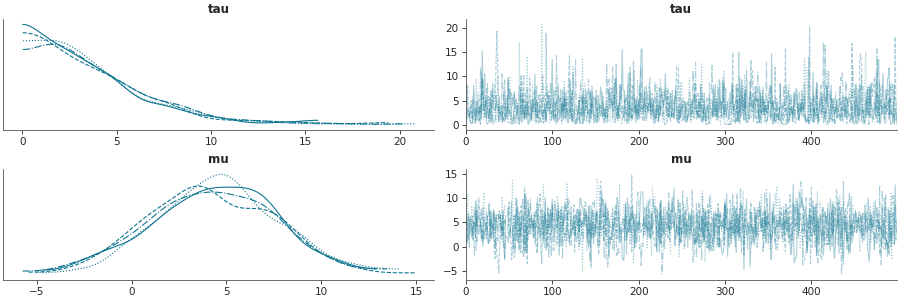
Ctrl+K
ArviZ dev documentation - Home
dev
  • Getting Started
  • Example Gallery
  • User Guide
  • API
  • Community
    • Contributing
    • The ArviZ project
  • GitHub
  • Twitter
  • Mastodon
  • Getting Started
  • Example Gallery
  • User Guide
  • API
  • Community
    • Contributing
    • The ArviZ project
  • GitHub
  • Twitter
  • Mastodon
  • Example gallery
  • Traceplot

Traceplot#

See also

API Documentation: plot_trace()

../_images/mpl_plot_trace.png
import matplotlib.pyplot as plt

import arviz as az

az.style.use("arviz-doc")

data = az.load_arviz_data("non_centered_eight")
az.plot_trace(data, var_names=("tau", "mu"))

plt.show()

Download Python Source Code: matplotlib/mpl_plot_trace.py

import arviz as az

data = az.load_arviz_data("non_centered_eight")
ax = az.plot_trace(data, var_names=("tau", "mu"), backend="bokeh")

Download Python Source Code: bokeh/bokeh_plot_trace.py

previous

Forest Plot with ESS

next

Rank Bars Diagnostic with KDE

Edit on GitHub
Show Source
Support ArviZ

© Copyright 2018, ArviZ devs.

Created using Sphinx 7.2.6.

Built with the PyData Sphinx Theme 0.15.1.